Find the logs behind an Argo CD Application#
Lens premium subscription feature. See details on Lens Pricing.
An Application reports Degraded, and Argo CD tells you which resource is unhealthy but not why. The answer is in the container logs. This walks from the Application to those logs in one window.
Before you begin#
- Connect a cluster with Argo CD installed. See Configure Argo CD.
- Get a Plus, Pro, or Enterprise subscription plan, or a Personal subscription with an active trial.
Trace the Application to its logs#
- In the cluster navigator, select Argo CD > Dashboard.
- Select the Application under Needs attention.
- Read Health status in the detail panel. Its message names the failure.
-
Open the Managed resources section. Each row carries the resource kind, name, namespace, and its own sync and health status.
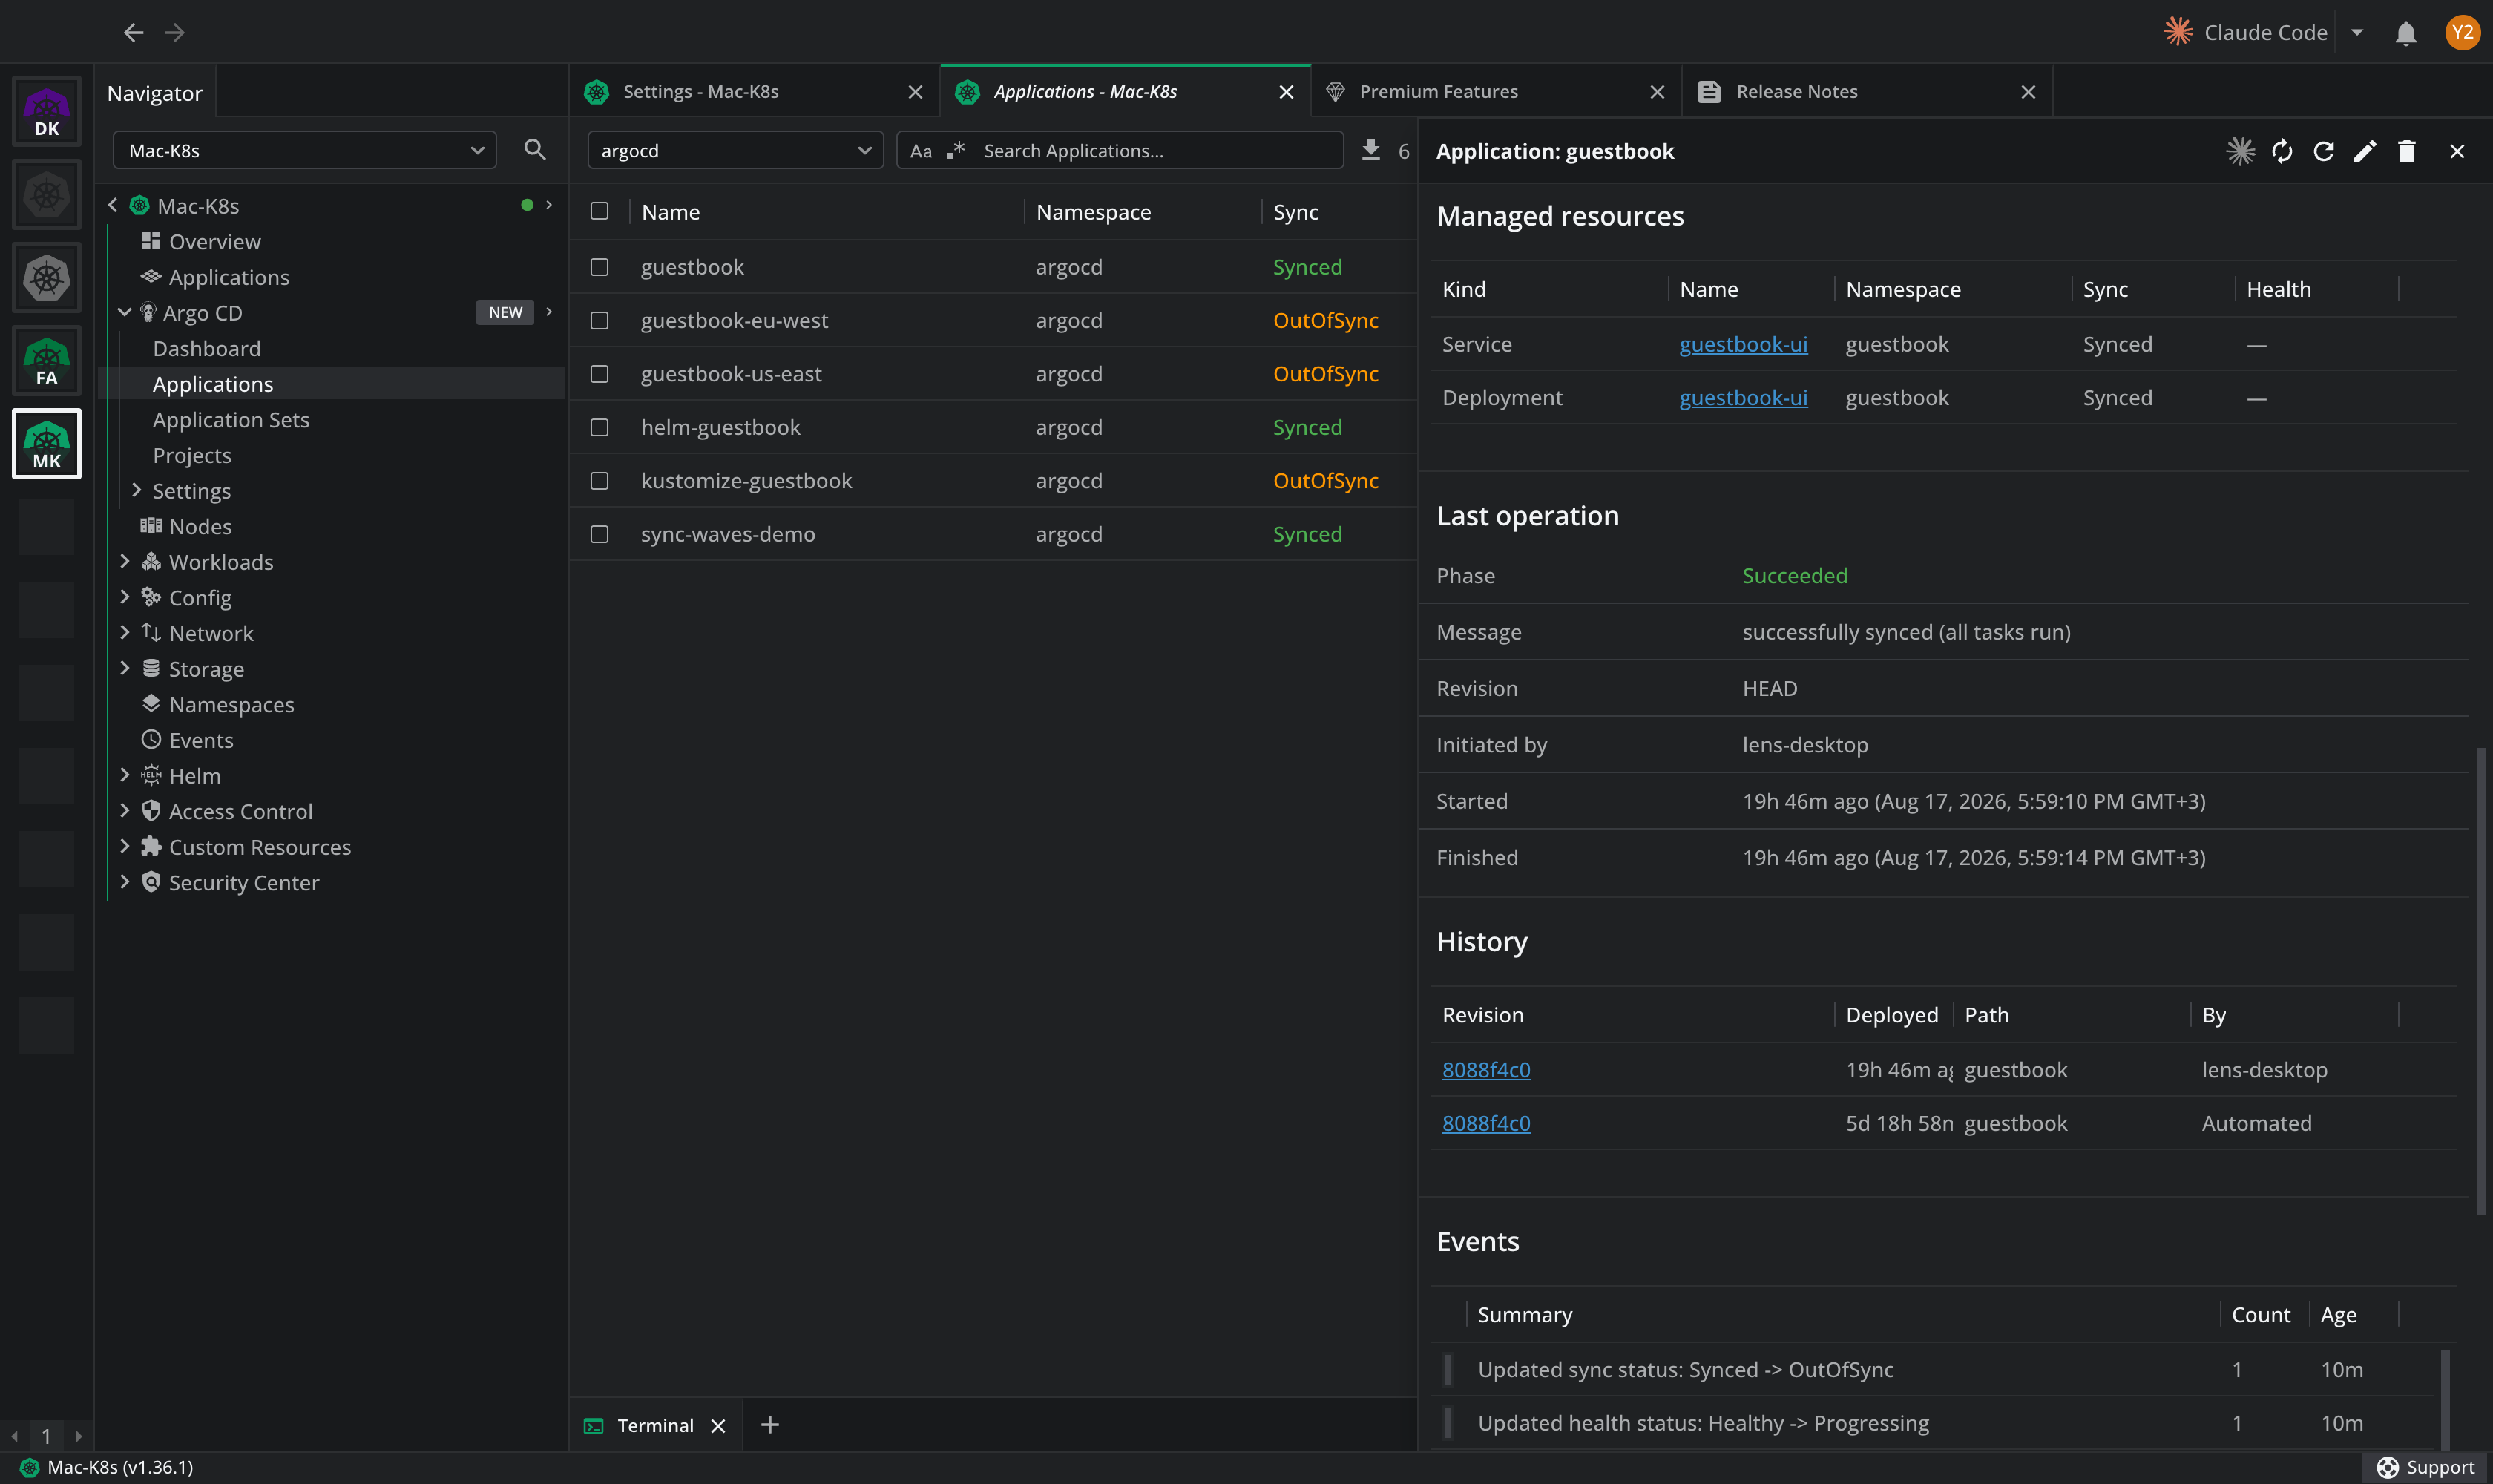
-
Select the name of the unhealthy resource. Lens K8S IDE opens that resource, still in the same window.
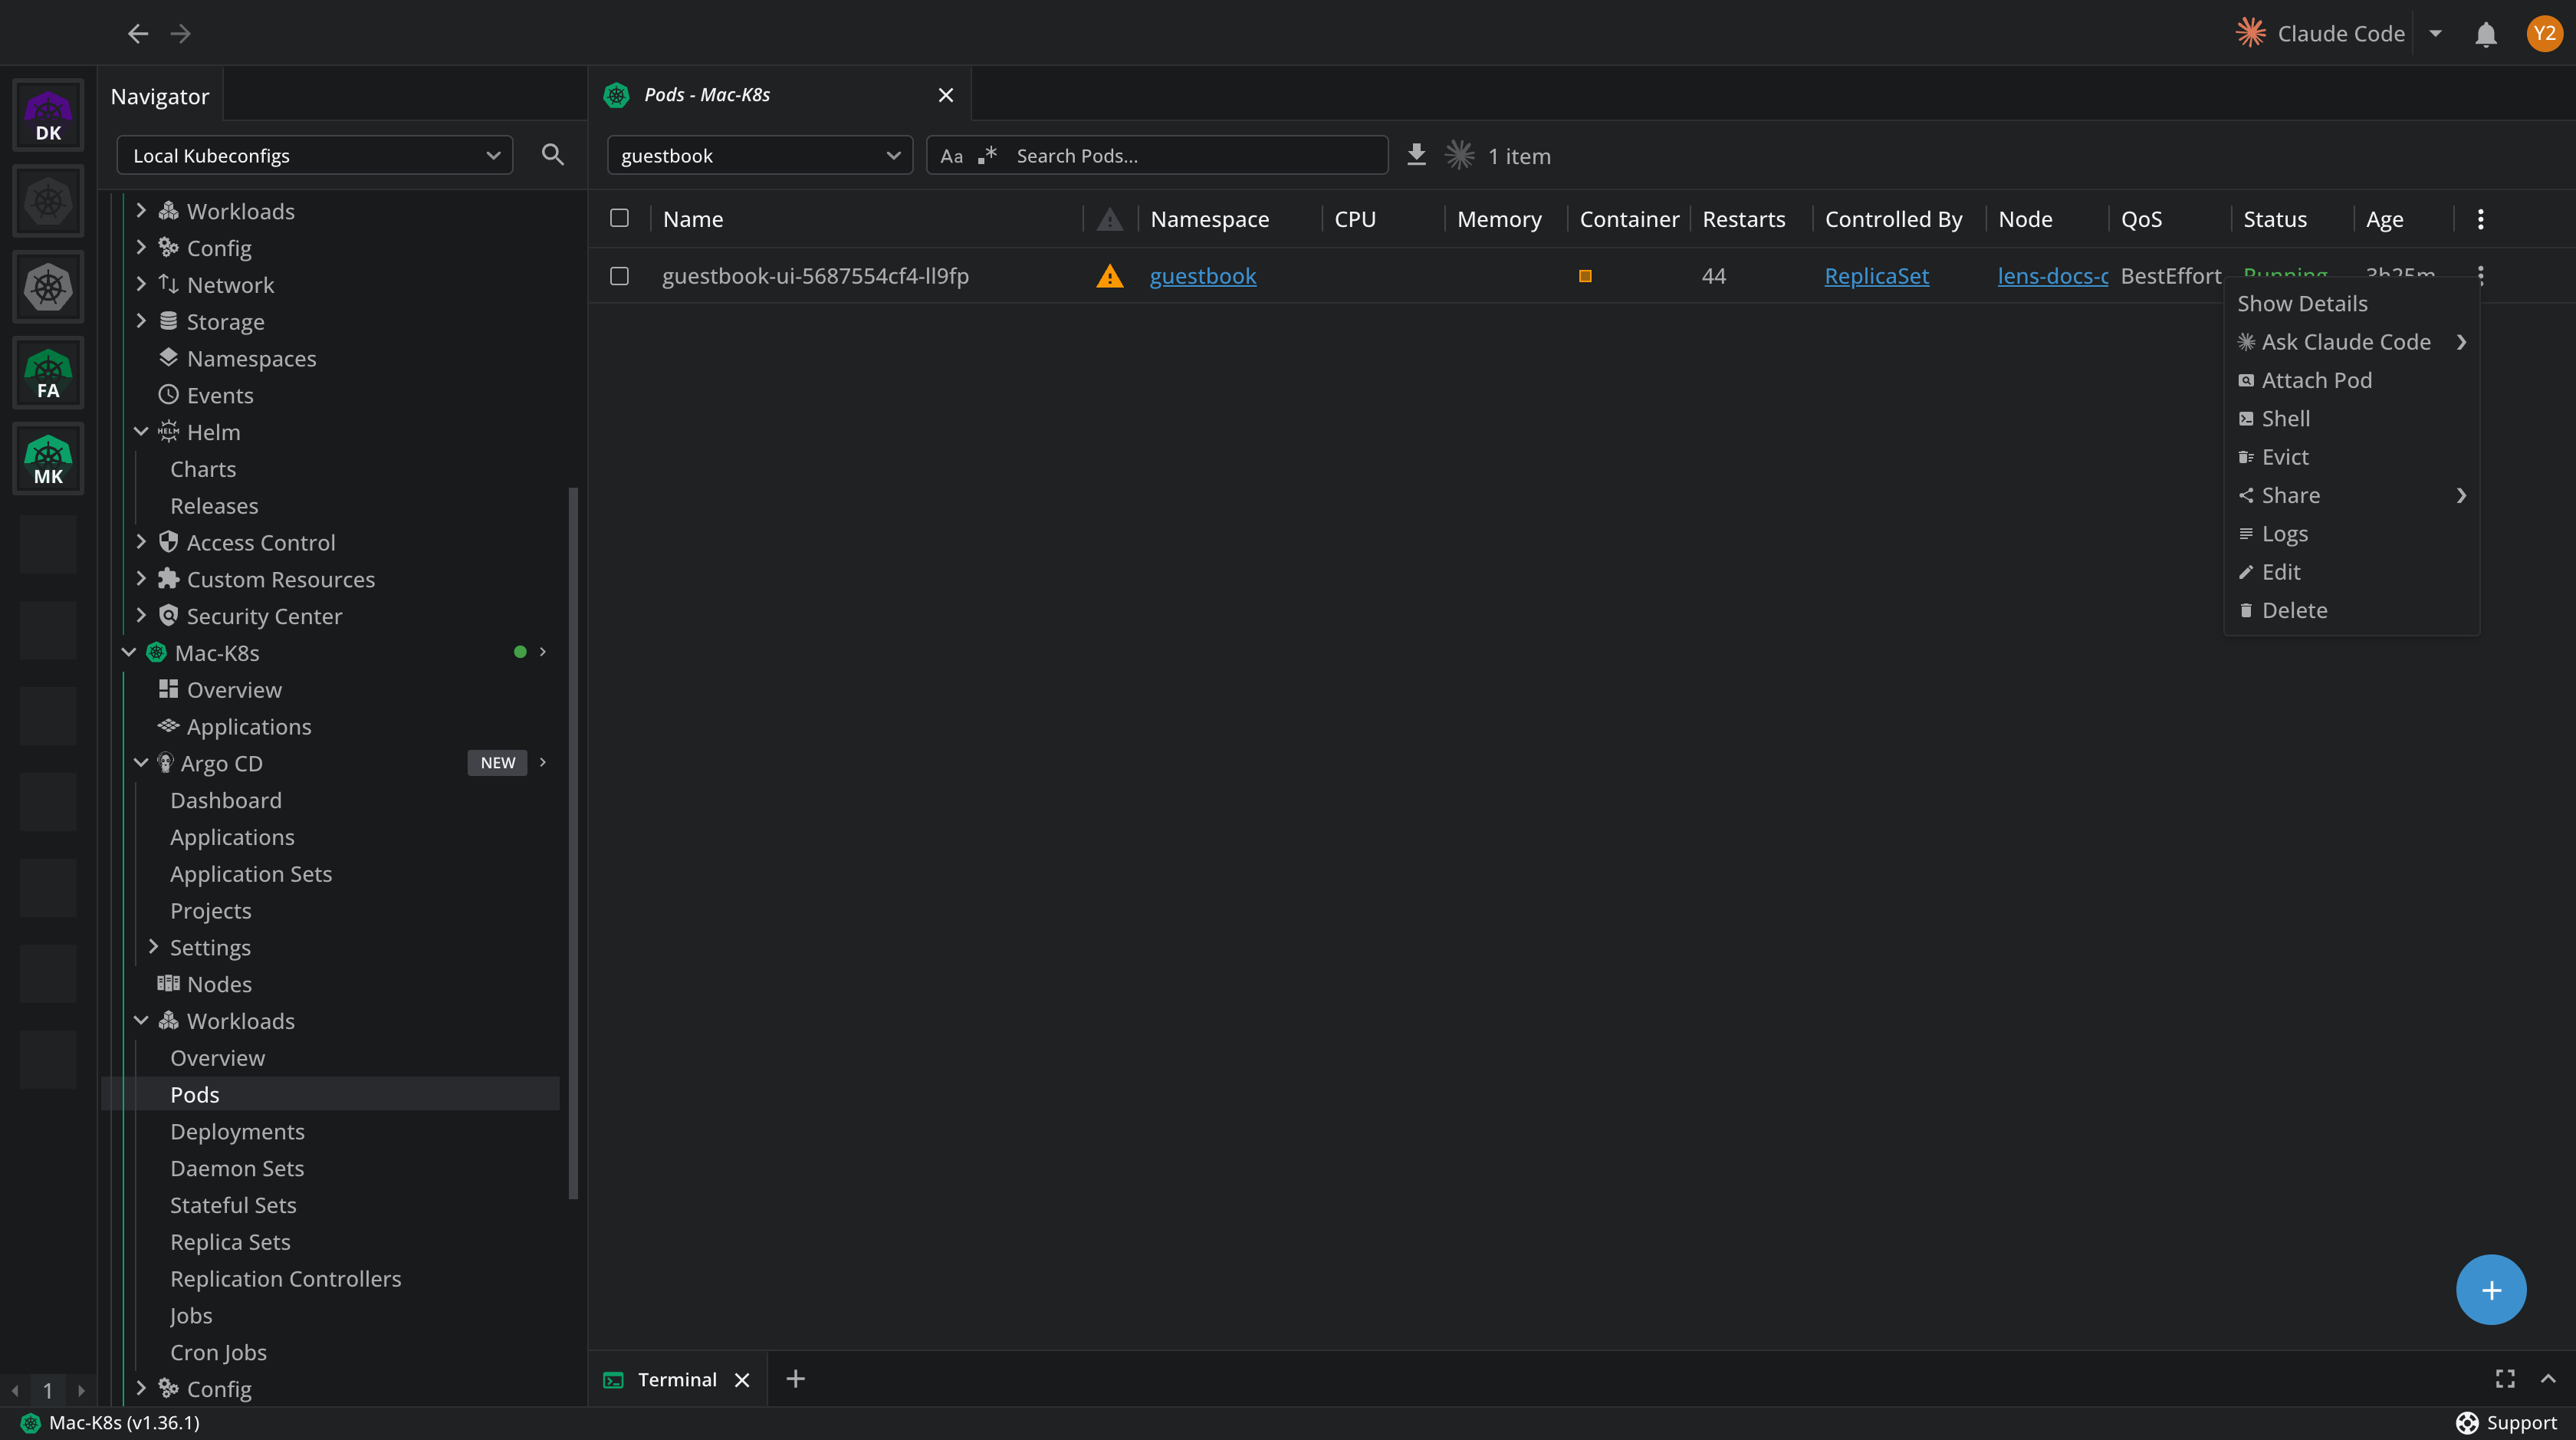
- In the cluster navigator, select Workloads > Pods, then set the namespace selector to the one the Application deploys into.
-
Right-click the failing pod and select Logs.
The container output opens in the bottom pane, in the same window as the Argo CD section that sent you there.
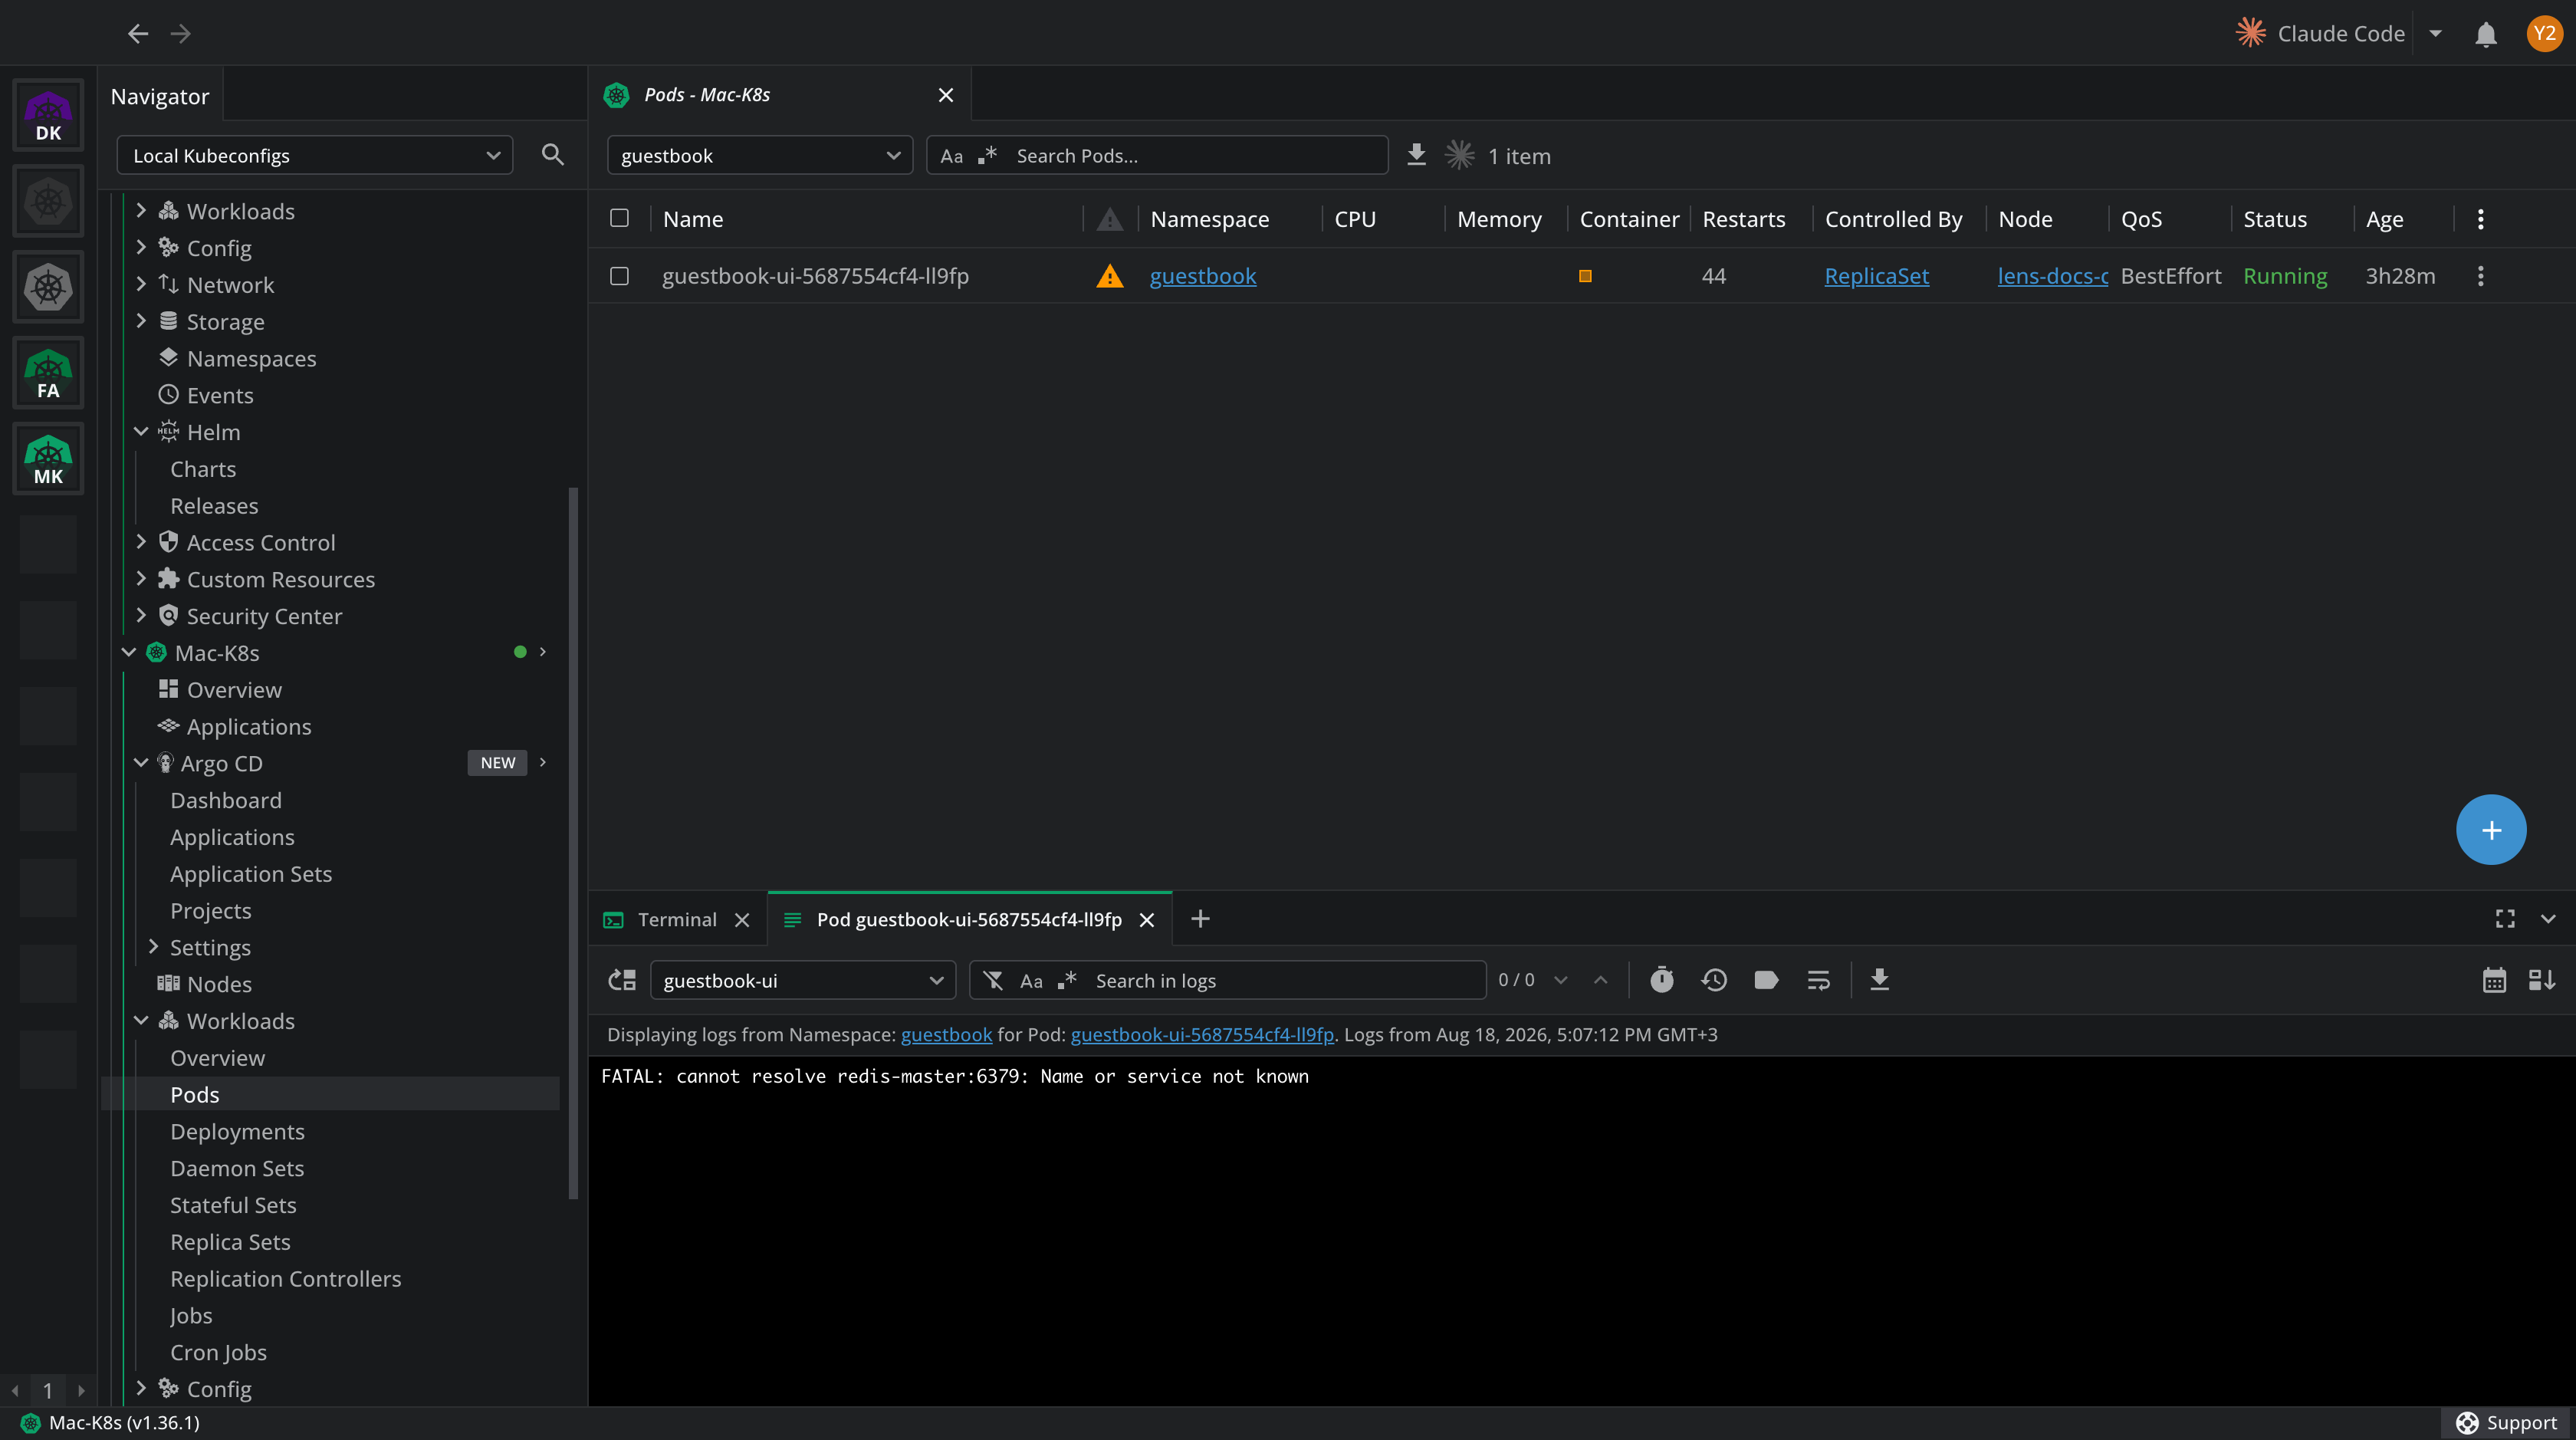
The full log viewer applies: search, timestamps, previous container, and download. See View logs.
Ask AI instead of reading#
To skip the manual trace, right-click the Application and select Summarize. Lens K8S IDE launches your configured AI tool against the Application, so it collects the status, events, and logs of the resources it manages. See Work with Ask AI.