Using Cost Monitoring#
Lens premium subscription feature. See details on Lens Pricing.
The Cost Monitoring dashboard shows what a cluster costs over the last 24 hours, 7 days, or 30 days, broken down by namespace. See Configure Cost Monitoring for requirements and how to open the entry.
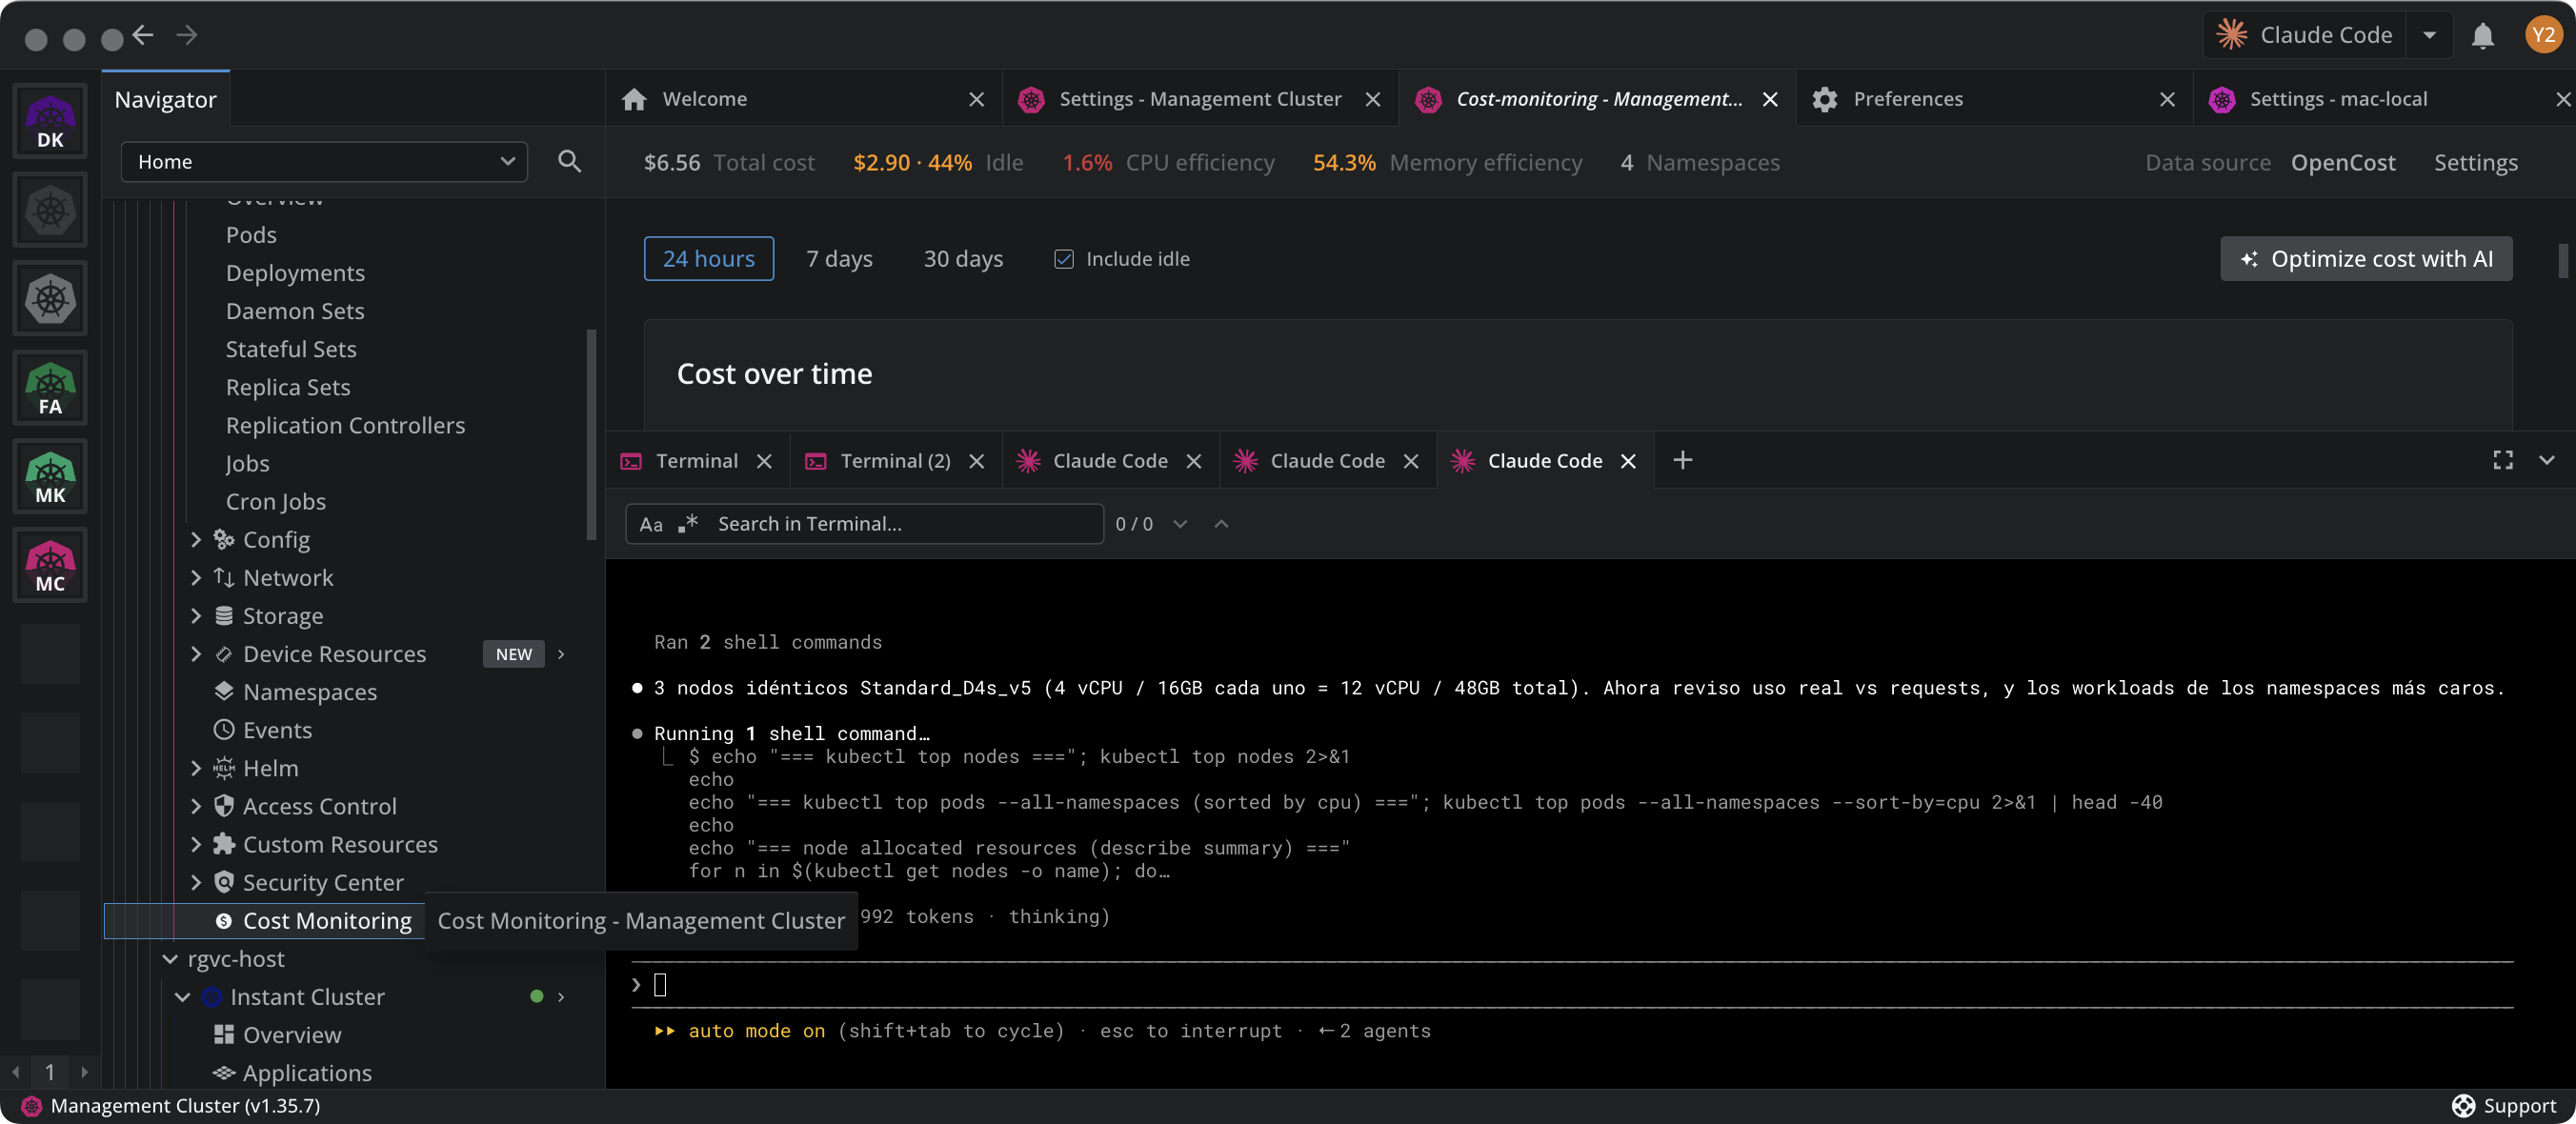
The dashboard opens on the status bar and the two panels below it. The Cost Monitoring entry stays highlighted in the navigator while it is open:
Read the dashboard#
The status bar at the top summarizes the selected window:
| Figure | What it reports |
|---|---|
| Total cost | The cost of the cluster over the window, in the currency the source reports. |
| Idle | Cluster capacity no workload requested, as an amount and a share of the total. It appears when you include idle and the source reports it. |
| CPU efficiency | Cluster-wide CPU usage against requests, averaged over the window. |
| Memory efficiency | Cluster-wide memory usage against requests, averaged over the window. |
| Namespaces | The number of namespaces with workloads in the window. |
| Data source | The source the figures came from. Estimated figures carry an estimated at list price badge. |
Efficiency compares what workloads use against what they request. A low figure means a namespace reserves capacity it does not use, which is the capacity you can trim. A figure above 100% means workloads use more than they request, which risks eviction rather than costing you money.
Below the status bar:
- Window selector. Switch between 24 hours, 7 days, and 30 days. Lens remembers the choice per cluster.
- Include idle. Add the capacity nobody requested to the figures and the chart. Clear it to see what the workloads alone cost.
- Cost over time. Each namespace's cost per interval, stacked. The legend names the largest namespaces with their cost and share, and groups the rest as Other.
- Cost by namespace. The per-namespace breakdown across CPU, Memory, Storage, Network, and Total, with an Efficiency column. Select a column header to sort by it.
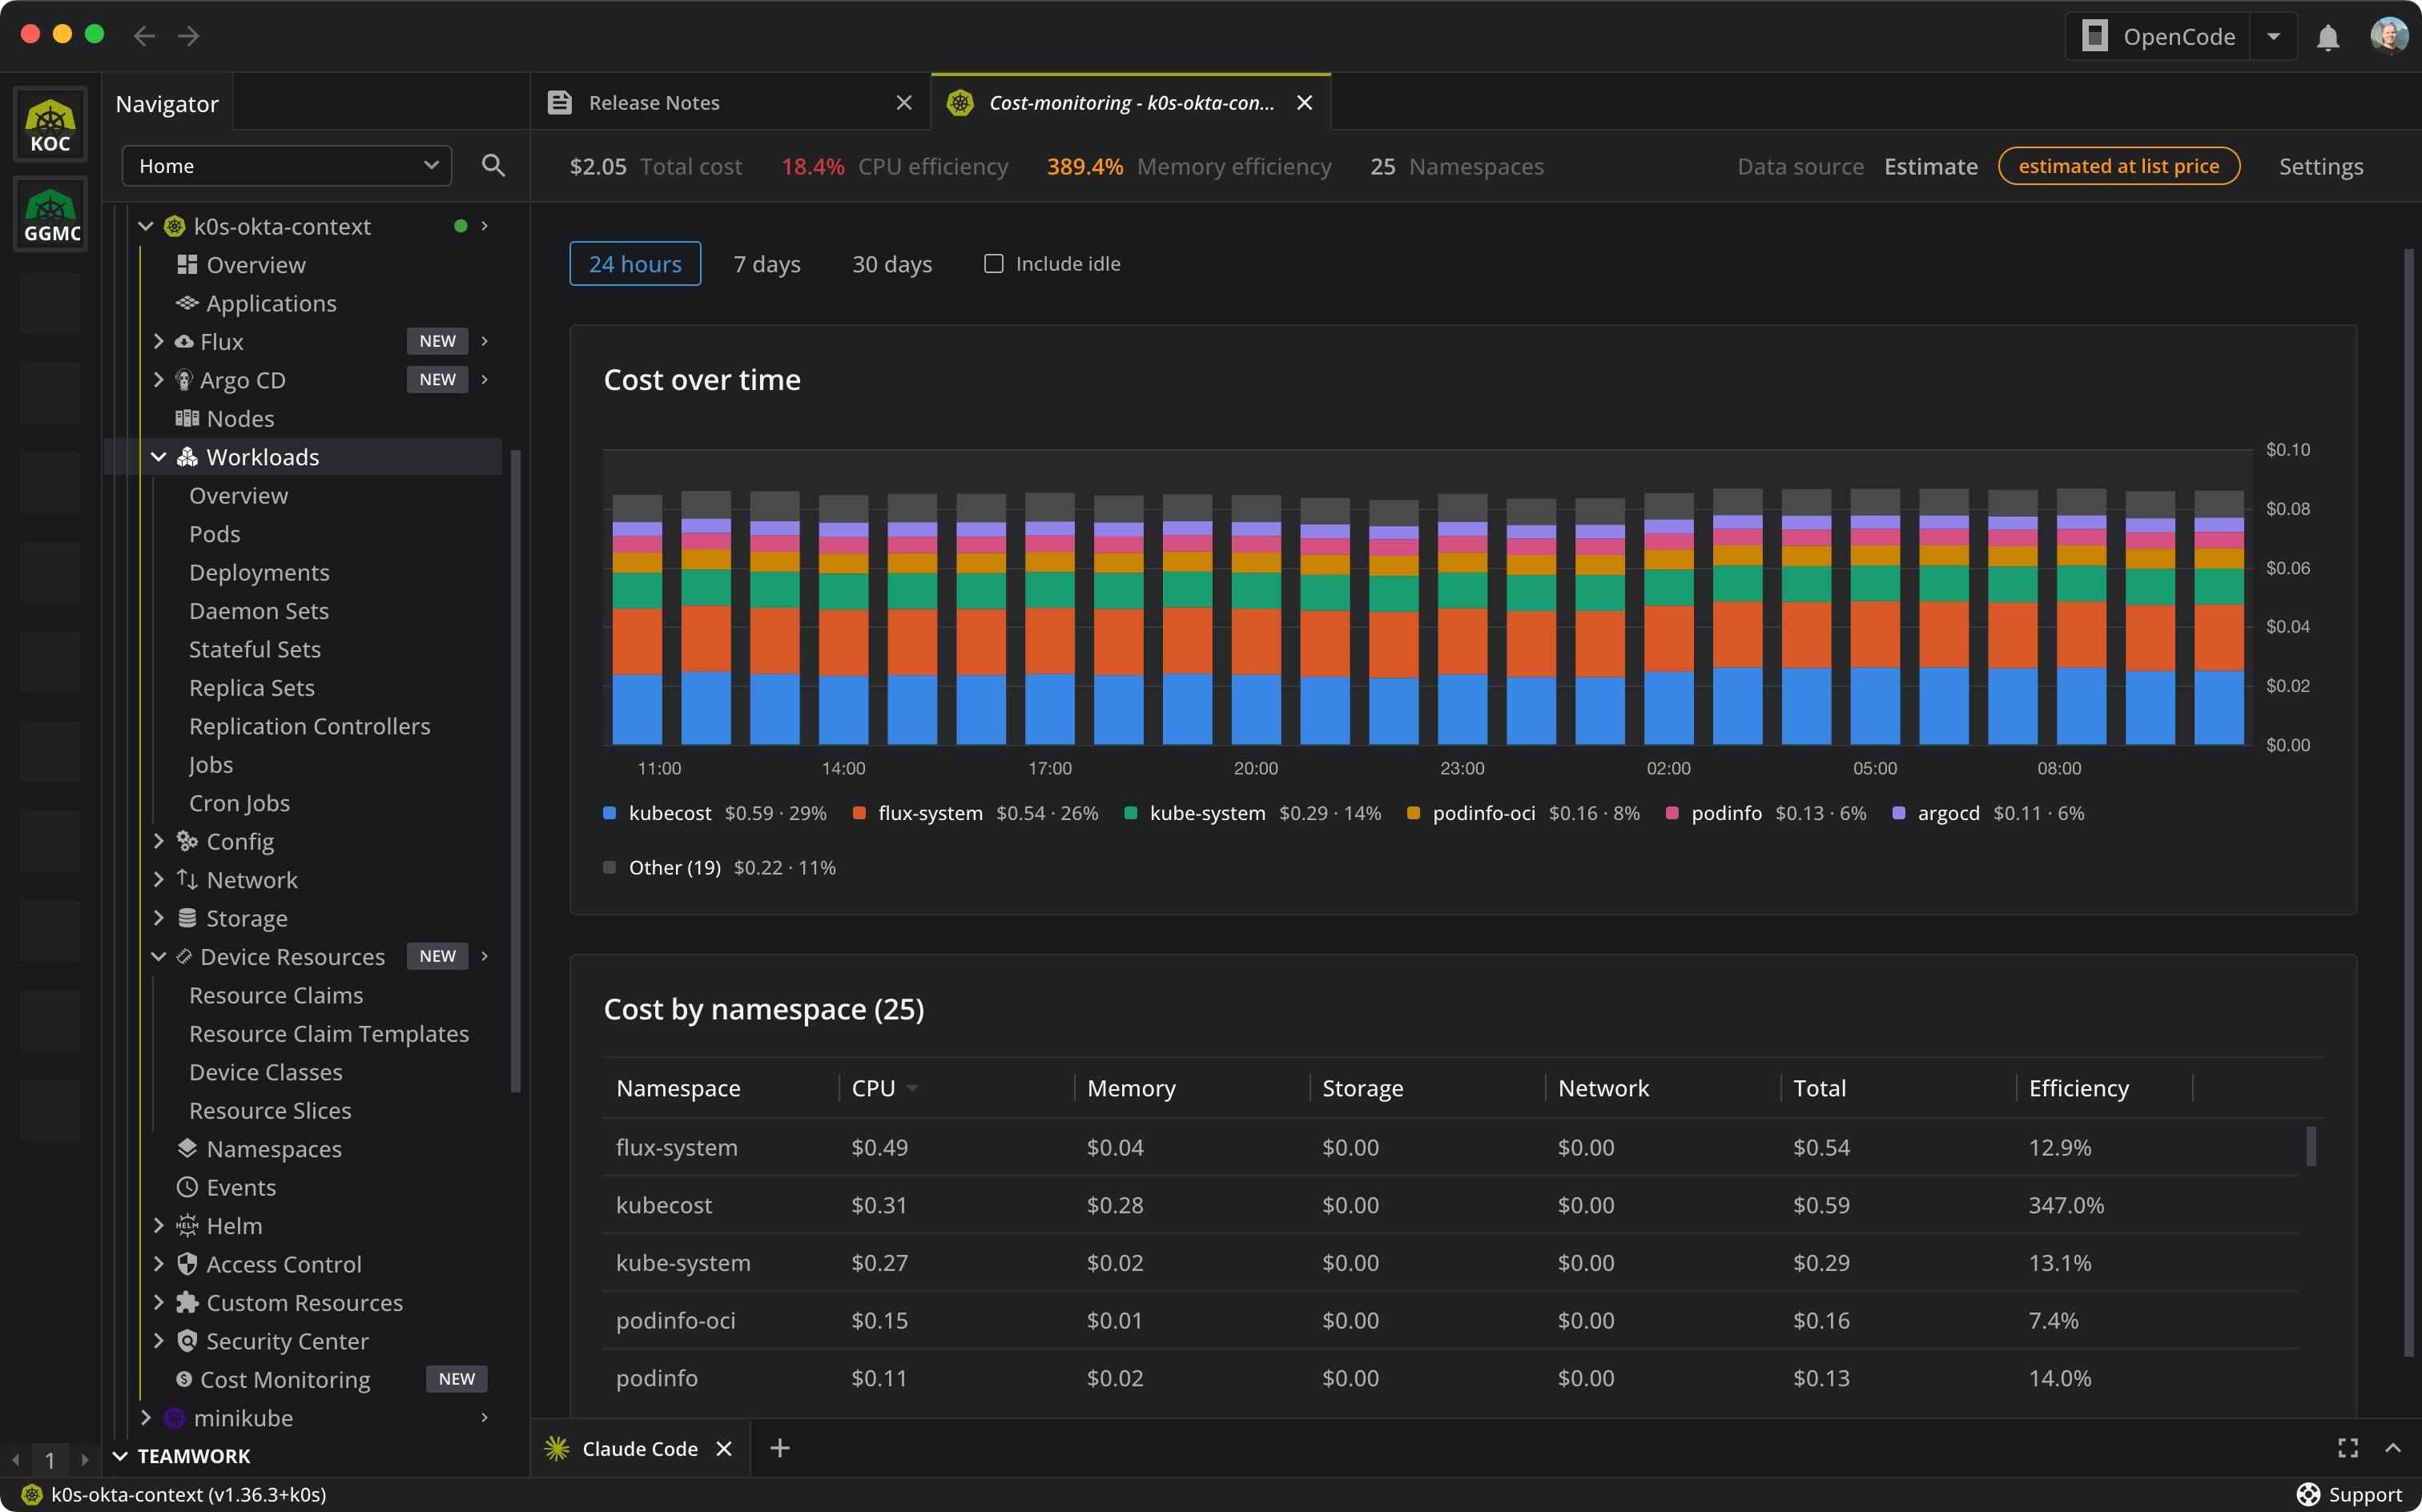
The figures refresh every minute. Namespace is the smallest unit Cost Monitoring reports: it does not break a namespace down into its workloads.
Optimize cost with AI#
Select Optimize cost with AI on the dashboard to hand the figures to your AI tool and ask it where to save. It comes back with ranked proposals, each costed against the figures above, and applies nothing until you accept.
See Optimize cost with AI for what Lens hands over, a real reply, and the requirements.